인터랙티브 대시보드 (Interactive Dashboard)
고급
학습 목표
이 레시피를 완료하면 다음을 할 수 있습니다:
- 정적 차트와 인터랙티브 차트의 차이 이해
- 대시보드 레이아웃 개념 잡기
참고: 본 Cookbook은 정적 빌드 사이트이므로, 인터랙티브 요소는 스크린샷이나 정적 예시로 대체됩니다.
0. 사전 준비 (Setup)
import pandas as pd
import numpy as np
import matplotlib.pyplot as plt

# 대시보드용 가상 데이터
df = pd.DataFrame({
    'Metric': ['Revenue', 'Cost', 'Profit'],
    'Value': [1000, 600, 400]
})
1. 대시보드 KPI 카드 예시
대시보드에서 가장 흔히 쓰이는 KPI 카드 형태를 시각화합니다.
fig, axes = plt.subplots(1, 3, figsize=(15, 4))
colors = ['blue', 'red', 'green']

for i, (metric, value, color) in enumerate(zip(df['Metric'], df['Value'], colors)):
    ax = axes[i]
    ax.text(0.5, 0.7, metric, ha='center', va='center', fontsize=20, color='gray')
    ax.text(0.5, 0.4, f"${value}", ha='center', va='center', fontsize=30, fontweight='bold', color=color)
    ax.axis('off')
    ax.set_title(f"KPI: {metric}")
    # 테두리 추가
    rect = plt.Rectangle((0,0), 1, 1, fill=False, color='gray', lw=2, transform=ax.transAxes)
    ax.add_patch(rect)

plt.suptitle('Dashboard KPI Overview')
plt.show()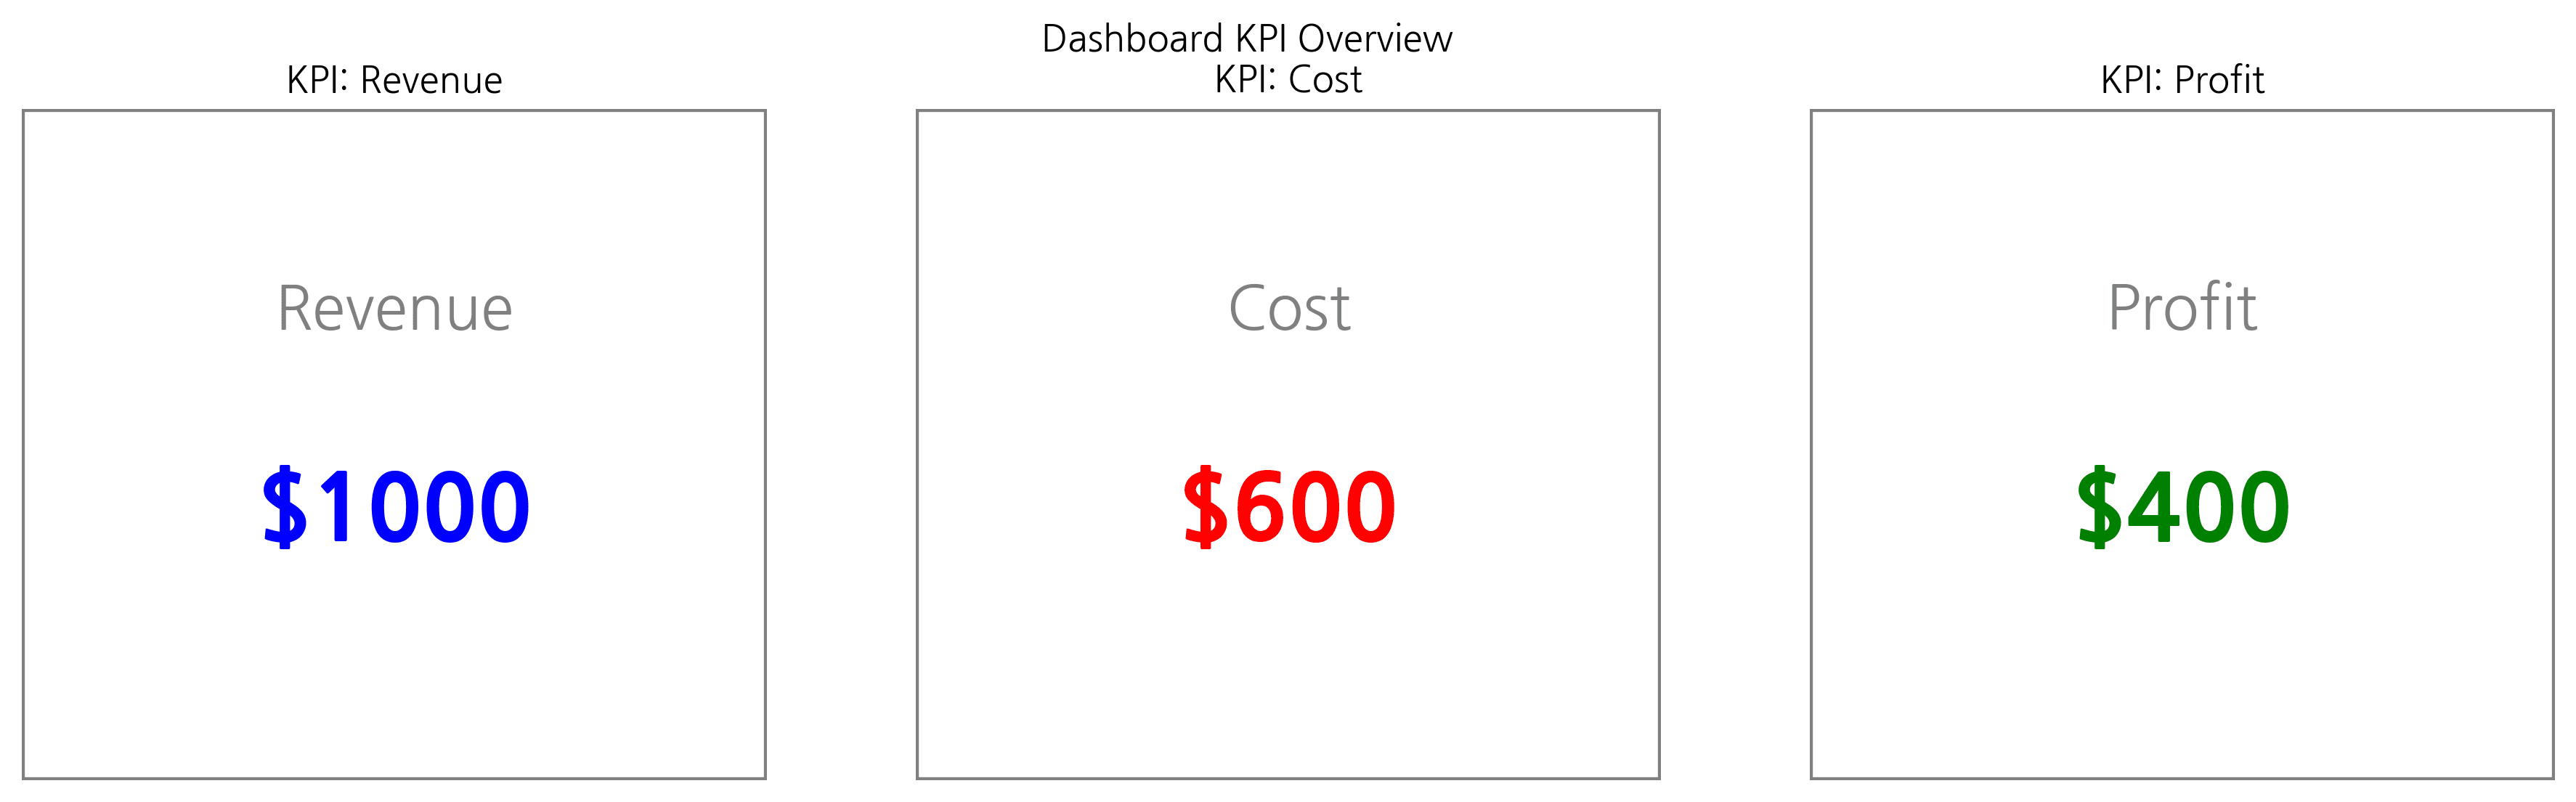
2. 복합 차트 레이아웃
여러 차트를 배치하여 대시보드 느낌을 구현합니다.
fig = plt.figure(figsize=(12, 8))
gs = fig.add_gridspec(2, 2)

# Top Left: Bar
ax1 = fig.add_subplot(gs[0, 0])
ax1.bar(['A', 'B', 'C'], [10, 20, 15], color='skyblue')
ax1.set_title('Sales by Category')

# Top Right: Line
ax2 = fig.add_subplot(gs[0, 1])
ax2.plot([1, 2, 3, 4, 5], [10, 12, 15, 14, 18], 'r-o')
ax2.set_title('Trend')

# Bottom: Scatter matches width
ax3 = fig.add_subplot(gs[1, :])
ax3.scatter(np.random.randn(50), np.random.randn(50), c=np.random.randn(50))
ax3.set_title('Correlation Distribution')

plt.tight_layout()
plt.show()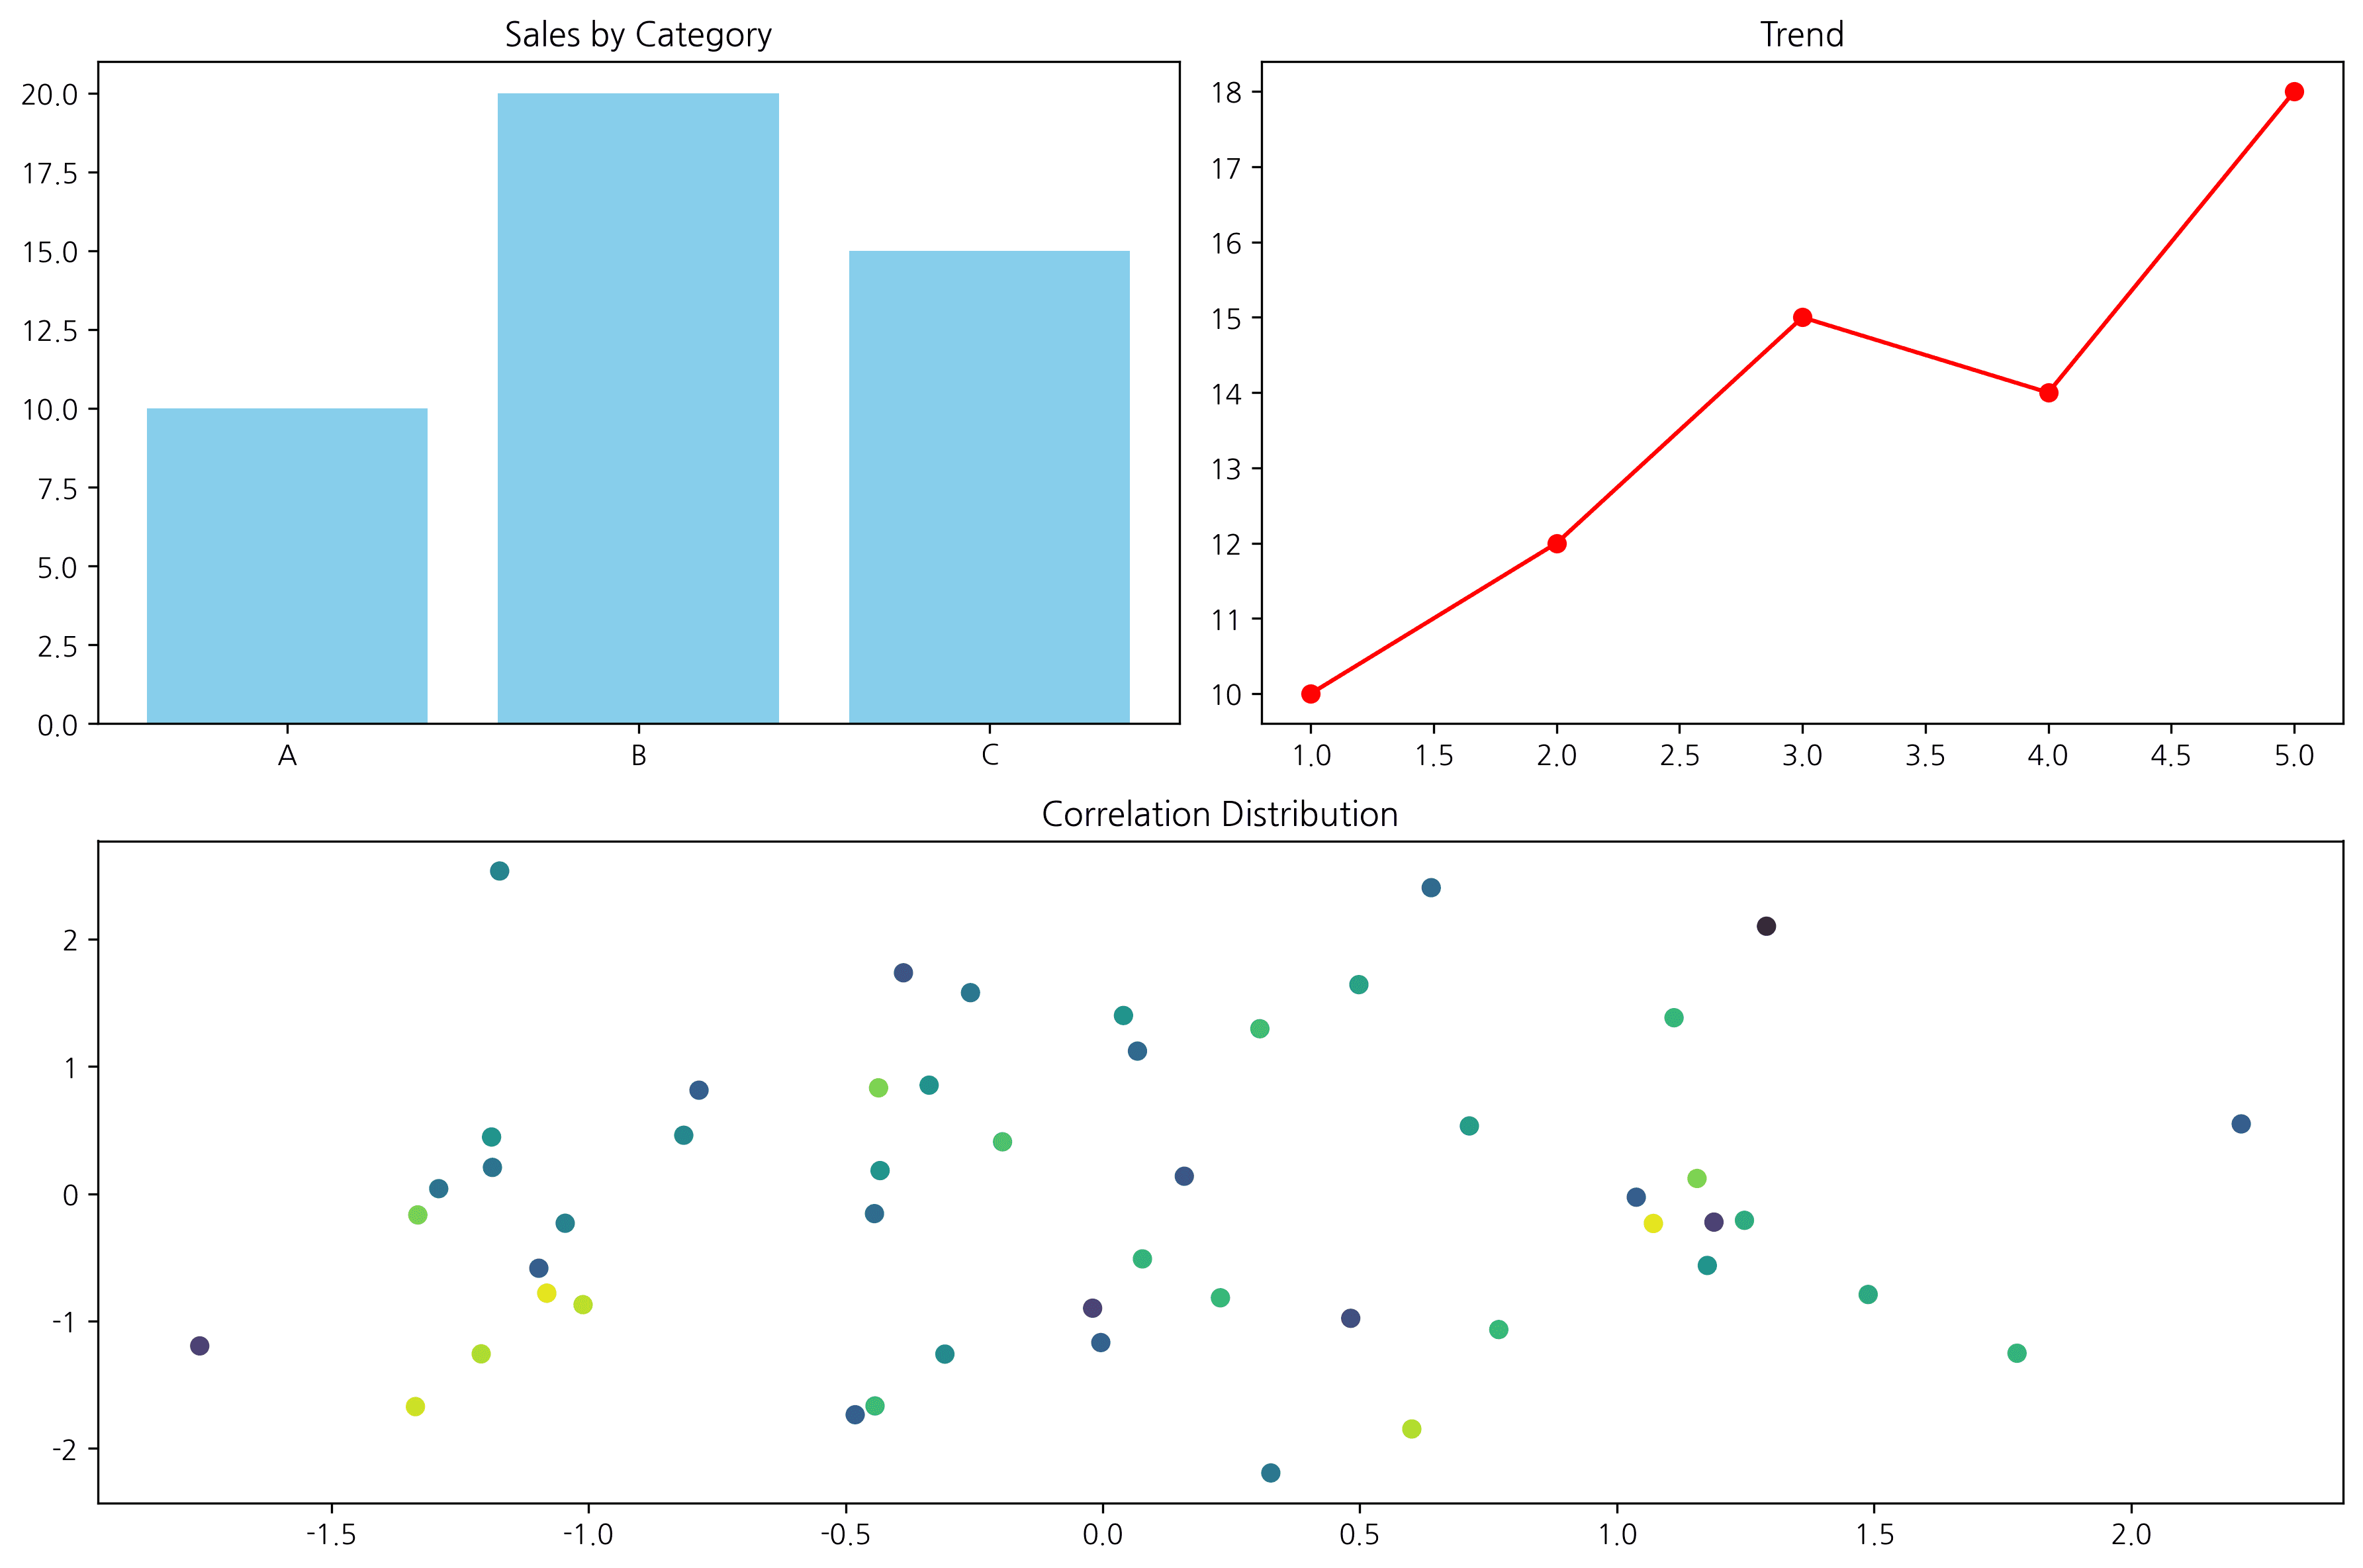
Last updated on