Sankey 다이어그램
중급
학습 목표
이 레시피를 완료하면 다음을 할 수 있습니다:
- Sankey 다이어그램의 구조와 용도 이해
- 데이터 흐름 시각화
- Matplotlib을 활용한 간단한 흐름도 구현
참고: Sankey 다이어그램은 주로 Plotly와 같은 인터랙티브 라이브러리를 사용하지만, 여기서는 정적 렌더링을 위해 Matplotlib을 활용한 예제를 다룹니다.
0. 사전 준비 (Setup)
import matplotlib.pyplot as plt
from matplotlib.sankey import Sankey

fig = plt.figure(figsize=(12, 6))
ax = fig.add_subplot(1, 1, 1, xticks=[], yticks=[], title="User Flow Sankey")

# Define flows and labels
flows = [100, -40, -30, -20, -10]
labels = ['Visit', 'Bounce', 'Search', 'Cart', 'Purchase']
orientations = [0, 1, 1, 0, 0]

sankey = Sankey(ax=ax, scale=0.01, offset=0.2, head_angle=150, format='%.0f', unit='%')
sankey.add(flows=flows, labels=labels, orientations=orientations,
           pathlengths=[0.25, 0.25, 0.25, 0.25, 0.25],
           patchlabel="Visitor Flow",
           alpha=0.6)
sankey.finish()
plt.show()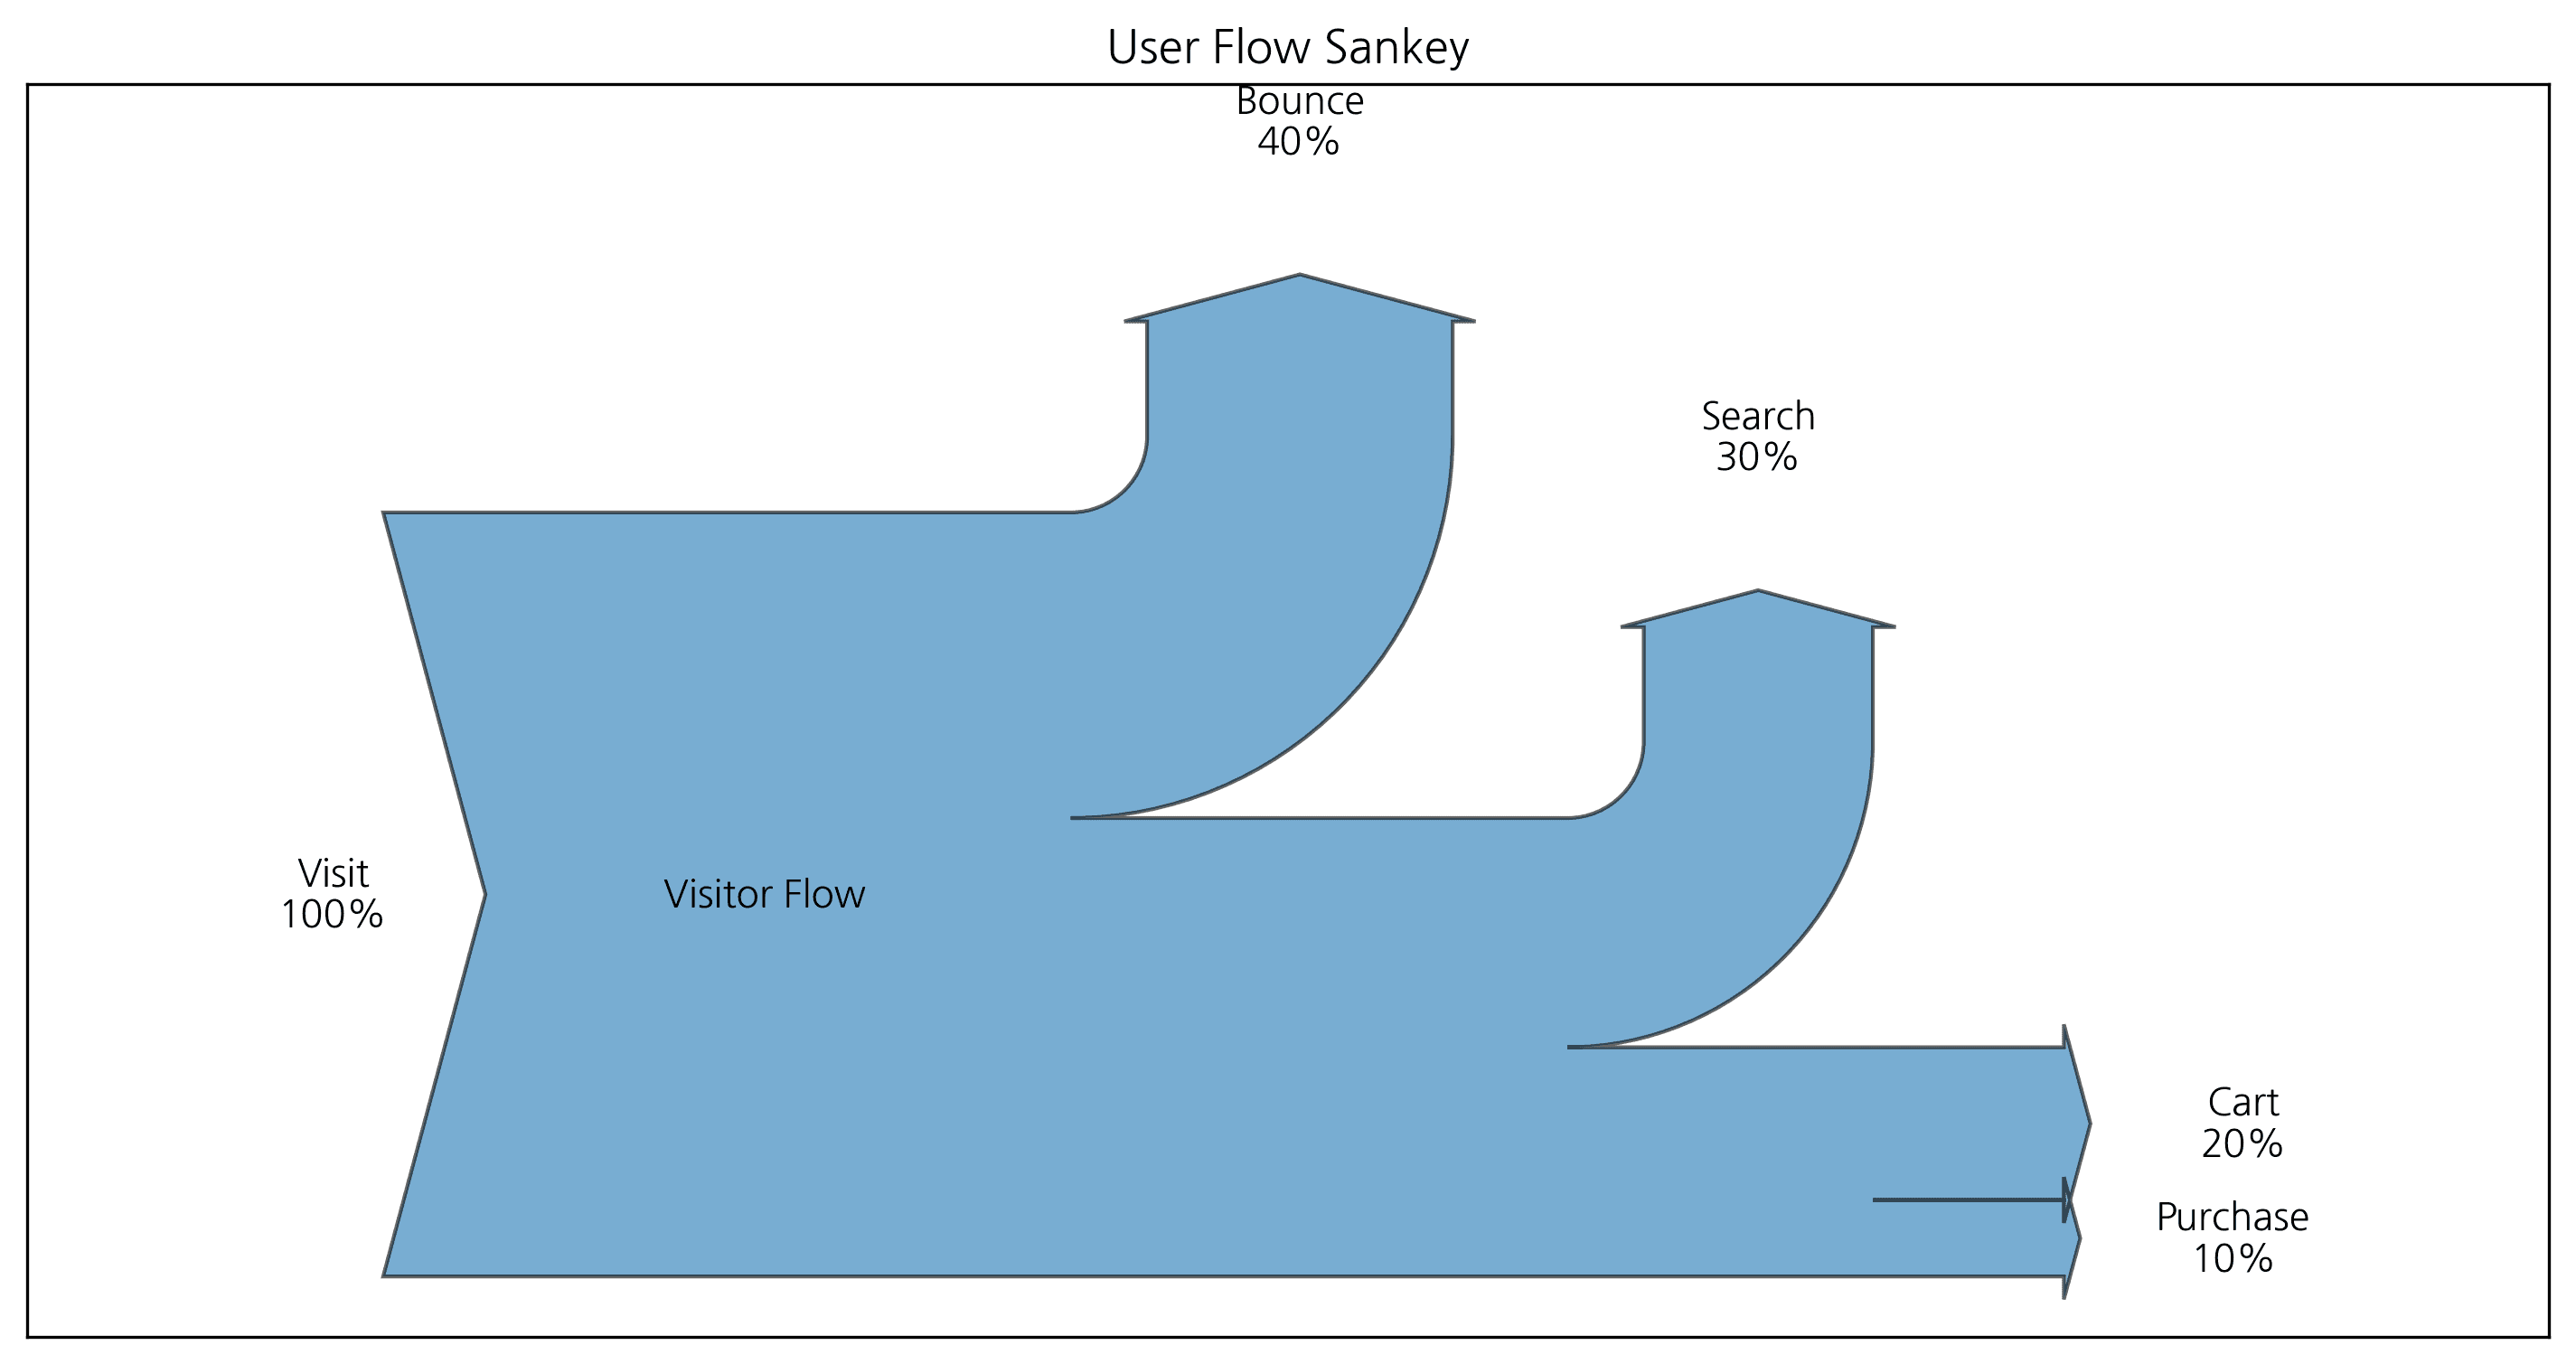
2. 복잡한 흐름 연결
두 개의 시스템 간 흐름을 연결할 수 있습니다.
fig = plt.figure(figsize=(12, 6))
ax = fig.add_subplot(1, 1, 1, xticks=[], yticks=[], title="Complex Flow")

sankey = Sankey(ax=ax, unit=None)
# 첫 번째 흐름
sankey.add(flows=[10, -3, -7], label='Input', orientations=[0, 0, 1])
# 두 번째 흐름 (첫 번째와 연결)
sankey.add(flows=[7, -2, -5], label='Output', prior=0, connect=(2, 0))
sankey.finish()
plt.show()
ℹ️
복잡한 흐름도 위와 같은 방식으로 연결하여 표현할 수 있습니다.
Last updated on