Sankey Diagram
Intermediate
Learning Objectives
After completing this recipe, you will be able to:
- Understand the structure and purpose of Sankey diagrams
- Visualize data flows
- Implement simple flow diagrams using Matplotlib
Note: Sankey diagrams are typically created using interactive libraries like Plotly, but here we cover examples using Matplotlib for static rendering.
0. Setup
import matplotlib.pyplot as plt
from matplotlib.sankey import Sankey

fig = plt.figure(figsize=(12, 6))
ax = fig.add_subplot(1, 1, 1, xticks=[], yticks=[], title="User Flow Sankey")

# Define flows and labels
flows = [100, -40, -30, -20, -10]
labels = ['Visit', 'Bounce', 'Search', 'Cart', 'Purchase']
orientations = [0, 1, 1, 0, 0]

sankey = Sankey(ax=ax, scale=0.01, offset=0.2, head_angle=150, format='%.0f', unit='%')
sankey.add(flows=flows, labels=labels, orientations=orientations,
           pathlengths=[0.25, 0.25, 0.25, 0.25, 0.25],
           patchlabel="Visitor Flow",
           alpha=0.6)
sankey.finish()
plt.show()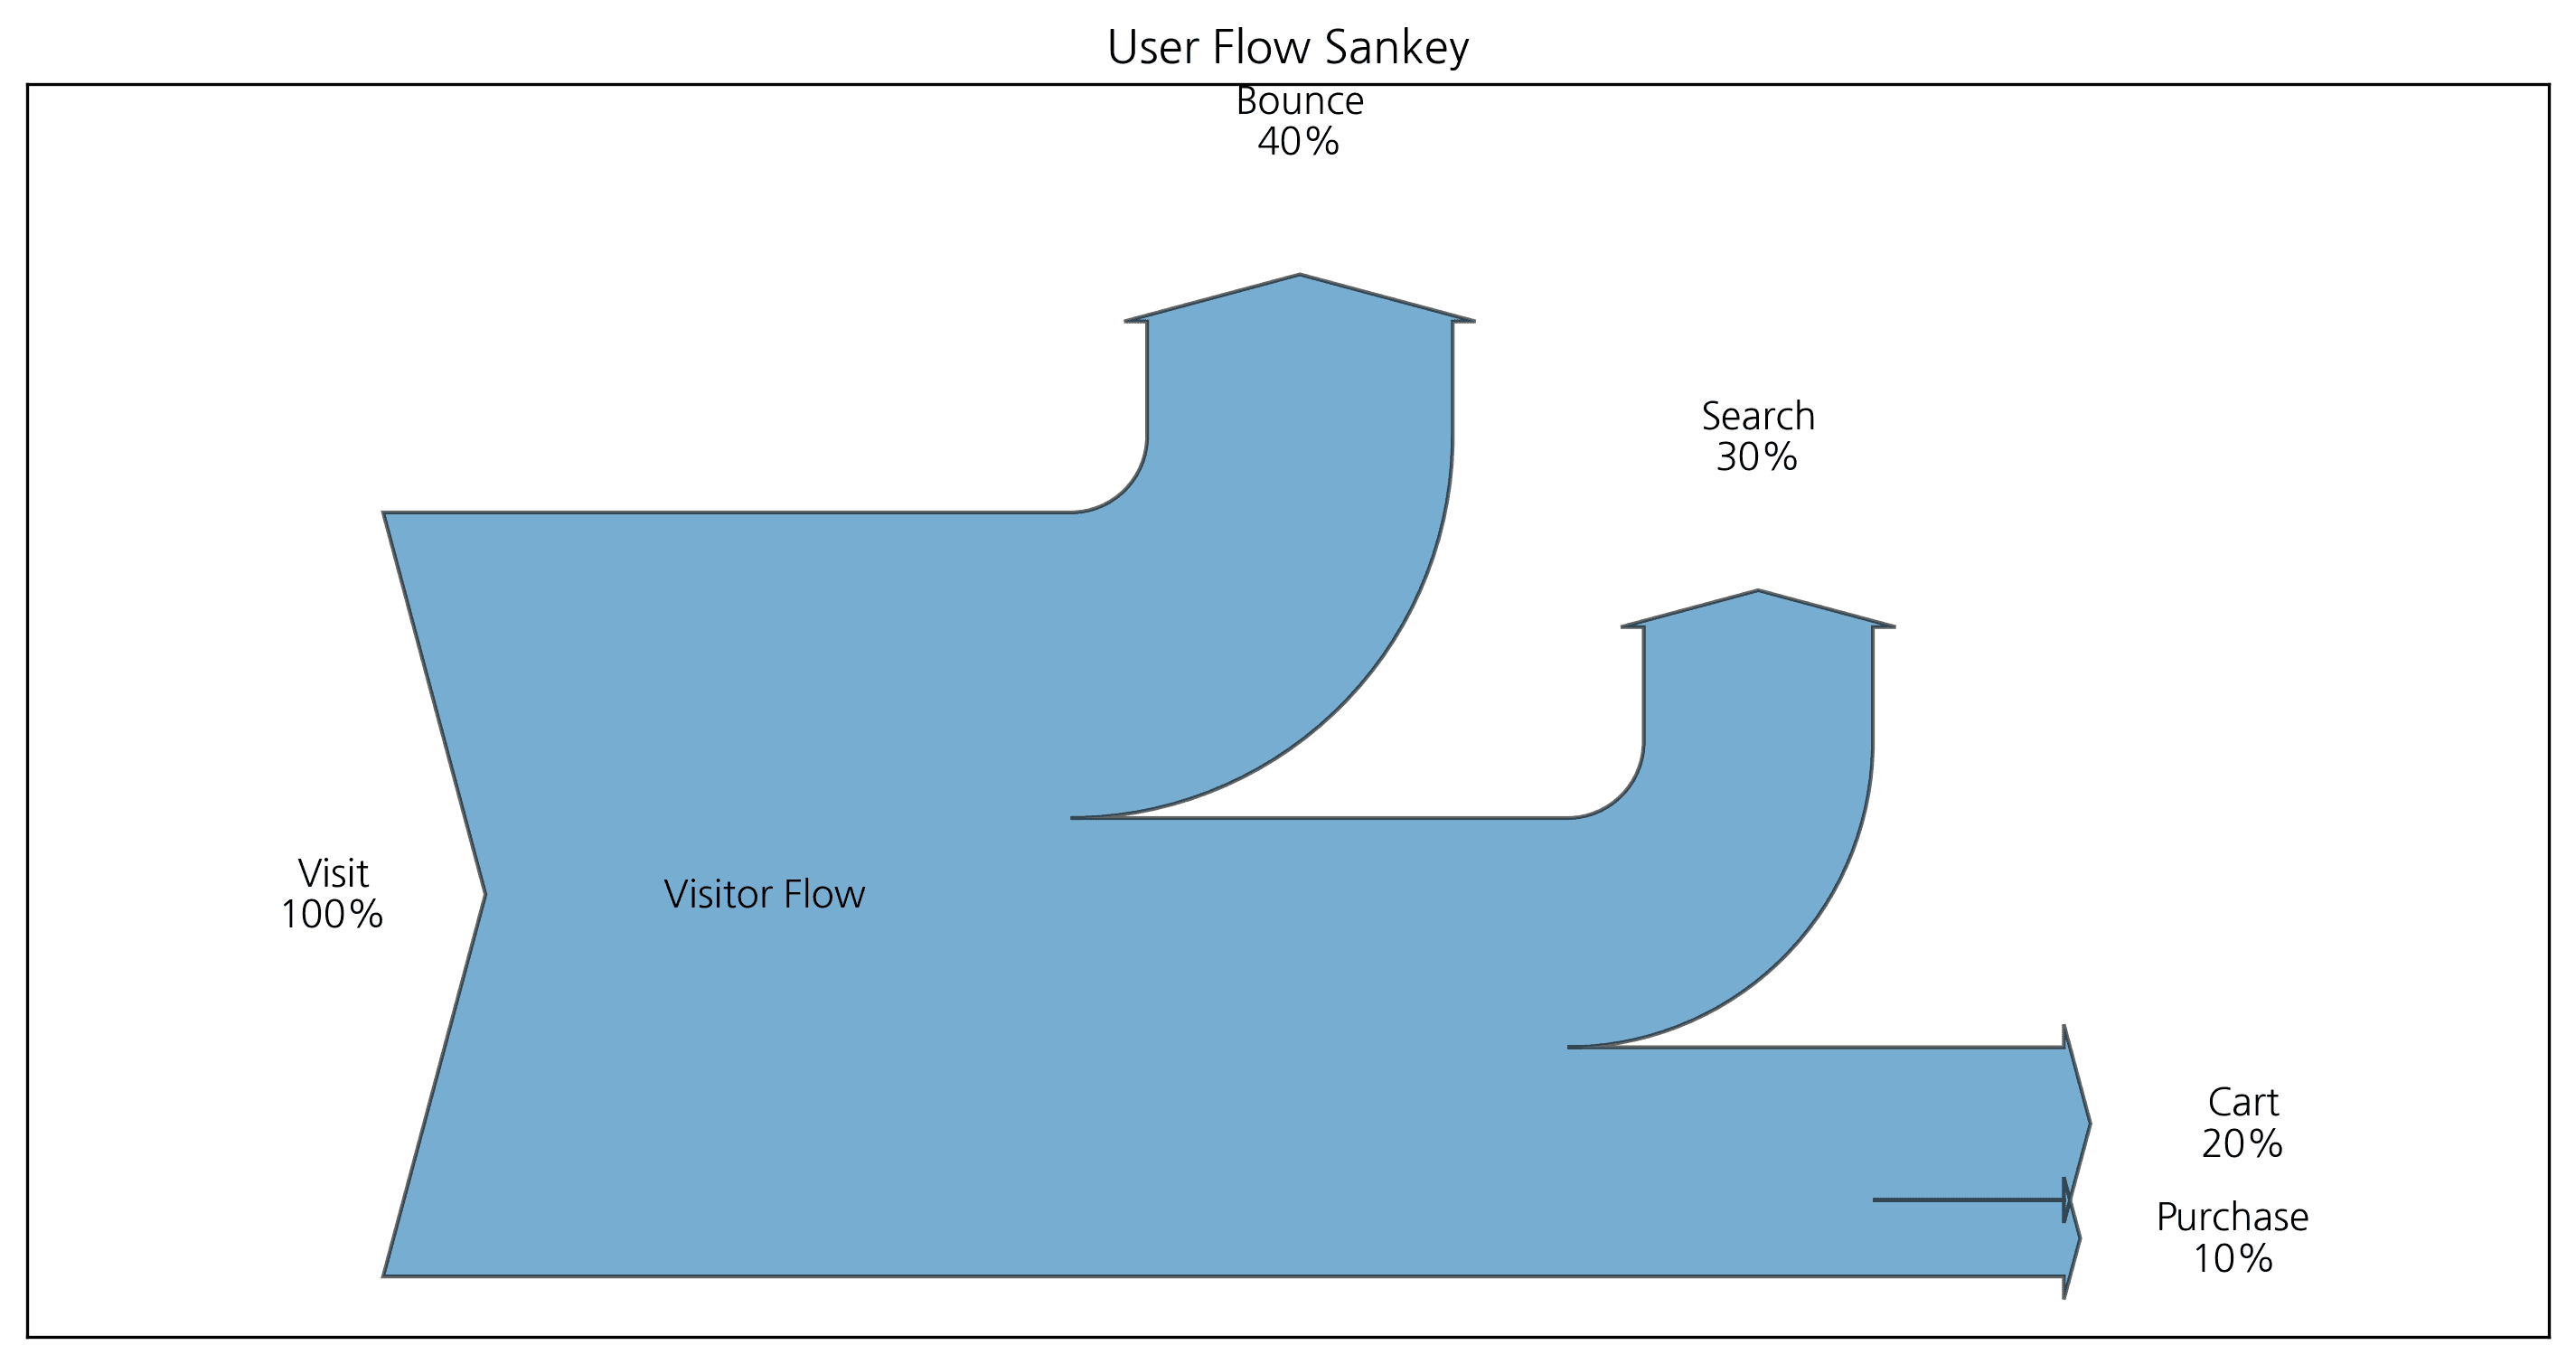
2. Connecting Complex Flows
You can connect flows between two systems.
fig = plt.figure(figsize=(12, 6))
ax = fig.add_subplot(1, 1, 1, xticks=[], yticks=[], title="Complex Flow")

sankey = Sankey(ax=ax, unit=None)
# First flow
sankey.add(flows=[10, -3, -7], label='Input', orientations=[0, 0, 1])
# Second flow (connected to the first)
sankey.add(flows=[7, -2, -5], label='Output', prior=0, connect=(2, 0))
sankey.finish()
plt.show()
ℹ️
Complex flows can be represented by connecting them in this manner as shown above.
Last updated on